

How to Calculate ROI for Commercial Battery Energy Storage Systems
Nov. 13, 2026
A factory may spend thousands of dollars each month on peak electricity demand, while a warehouse with rooftop solar may export low-value electricity during the day and buy it back at higher prices in the evening. A reliable commercial battery storage ROI calculation helps determine whether battery storage can reduce these expenses enough to justify the investment.
Start by calculating net project investment and the annual cash flows produced by a realistic battery dispatch schedule. First-year net benefit divided by initial investment is a useful screening percentage. A complete ROI assessment also evaluates simple payback, lifecycle returns, net present value (NPV) and internal rate of return (IRR), including degradation and replacement costs. For businesses considering HiTHIUM commercial and industrial battery energy storage systems, understanding these figures is an important step toward selecting the appropriate storage capacity, operating strategy, and investment model.
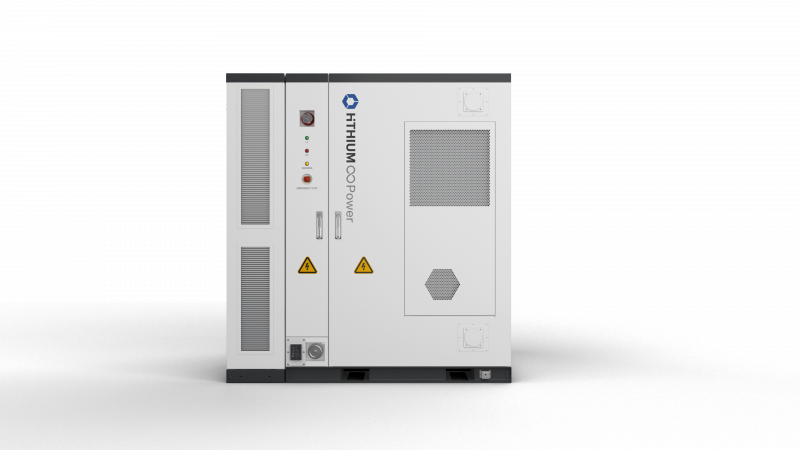
What Is ROI for Commercial Battery Storage
ROI measures the financial return generated by a battery energy storage investment relative to its cost. For commercial and industrial facilities, the return usually comes from reducing electricity bills, shifting energy consumption, increasing on-site solar utilization, or earning eligible grid-service revenue. Unlike a conventional energy efficiency upgrade, battery storage does not necessarily reduce the total electricity consumed by a facility. Instead, it changes when electricity is purchased, stored, and used. Because charging and discharging introduce energy losses, the financial benefit depends on whether the avoided electricity costs exceed the cost of charging and operating the system.
First Year Net Benefit Ratio and Simple Payback
First-Year Net Benefit Ratio (%) = (First-Year Net Financial Benefit / Net Initial Investment) × 100
Where:
· Annual Net Financial Benefit: Annual electricity cost savings and eligible revenues minus recurring operating expenses.
· Initial Investment: The net upfront project cost, including equipment, installation, grid connection, and other applicable expenses, less confirmed upfront incentives.
For a quick estimate, the simple payback period can be calculated separately:
Simple Payback Period (Years) = Initial Investment / Annual Net Financial Benefit
For example, if a business invests $350,000 in a battery storage project and generates $43,700 in annual net savings:
· First-year net benefit ratio = ($43,700 / $350,000) × 100 = 12.49%
· Simple payback = $350,000 / $43,700 = 8.01 years
This means the project would recover its initial investment in approximately eight years if annual savings remain constant. Actual savings may change with electricity tariffs, operational schedules, maintenance costs, and battery performance. The first-year net benefit ratio is a simple screening metric. It is neither IRR nor the total return over the project life. Discounted cash flow analysis is needed to account for the timing of expenses, future savings and equipment replacement.
What Data Do You Need for a Commercial and Industrial Battery Energy Storage ROI Calculation
Before opening an ROI spreadsheet, collect the site's actual electricity consumption data and the complete installed system quotation. An inaccurate electricity tariff or incomplete installation cost can make an otherwise detailed calculation misleading.
Electricity Bills and Load Profile Data
Gather at least 12 months of electricity bills to identify seasonal demand changes. Where available, obtain 15-minute or 30-minute interval electricity consumption data.
Required Information | Why It Matters | Typical Data Source |
Annual electricity consumption (kWh) | Establishes overall electricity demand and the potential for energy shifting. | Utility bills or energy management system |
Peak electricity demand (kW) | Identifies the maximum power demand that may contribute to demand charges. | Utility meter or interval load data |
Peak and off-peak electricity prices ($/kWh) | Determines the potential savings from time-of-use energy shifting. | Electricity tariff agreement |
Demand charges ($/kW/month) | Determines the financial value of reducing billing demand. | Utility billing schedule |
Solar PV generation (kWh) | Helps estimate how much otherwise-exported or curtailed solar electricity can be stored. | Solar monitoring platform |
Operating hours and production schedules | Identifies when the facility requires high power or experiences low electricity prices. | Facility operating records |
Outage history and critical loads | Supports a separate assessment of backup-power requirements and avoided interruption costs. | Maintenance and production records |
Battery Energy Storage System Technical Specifications
The battery's energy capacity and power rating directly affect how much electricity can be shifted and how much peak demand can be reduced.
Obtain the following technical information:
· Rated power (kW): Maximum continuous charging and discharging power under the specified operating conditions.
· Nominal and usable energy capacity (kWh): The amount of energy stored and the portion available within the permitted operating range.
· Round-trip efficiency (RTE): The ratio of discharged energy to charging energy, measured at a clearly defined system boundary.
· Depth of discharge (DoD): The permitted proportion of battery capacity used during operation.
· Cycle life: The number of charging and discharging cycles associated with specified test conditions and remaining capacity.
· Capacity degradation: Expected reduction in usable capacity over the operating period.
· Warranty conditions: Guaranteed performance, operating limits, energy throughput, and applicable exclusions.
For instance, a battery with a nominal capacity of 500 kWh and an assumed 90% usable capacity window would provide approximately 450 kWh of usable battery energy before accounting for applicable AC conversion losses. The manufacturer's usable-energy definition must be checked to avoid applying the same adjustment twice.
Installation and Operating Cost Information
The equipment purchase price is only part of the investment. A complete commercial battery storage cost analysis should include the following expenses.
Cost Category | Items to Include |
Battery equipment | Battery cabinets, modules, racks, and battery management system (BMS) |
Power conversion | Power conversion system (PCS), transformer, and associated electrical equipment |
Controls | Energy management system (EMS), monitoring, communications, and integration |
Installation | Civil works, foundations, wiring, switchgear, commissioning, and testing |
Grid connection | Interconnection studies, metering modifications, permits, and utility-required upgrades |
Annual operation | Maintenance, monitoring, software subscriptions, insurance, and auxiliary electricity consumption |
Lifecycle expenses | Scheduled component replacement, battery augmentation if required, and end-of-life management |
A spreadsheet is sufficient for the first calculation. For a more detailed assessment, an energy simulation tool can model hourly or sub-hourly dispatch, battery degradation, electricity tariff structures, and annual cash flows.
How to Calculate Commercial Battery Energy Storage ROI Step by Step
The following six-step process uses a hypothetical industrial facility to demonstrate the calculation. All prices, expenses, and savings in this example are illustrative assumptions, not measured results from a HiTHIUM installation or a quotation for a specific product.
Step 1 Determine the Initial Commercial BESS Investment
Consider a manufacturing facility evaluating a 250 kW / 500 kWh battery energy storage installation to manage peak electricity demand and shift electricity purchases to lower-price periods.
The facility receives the following assumed project cost estimate:
Project Item | Estimated Cost |
Battery system and power conversion equipment | $250,000 |
Installation and electrical integration | $65,000 |
Engineering, commissioning, and permits | $35,000 |
Total Initial Investment | $350,000 |
Initial Investment = $250,000 + $65,000 + $35,000 = $350,000
For this example, no upfront incentive is assumed. If a project qualifies for a grant or rebate, the applicable amount should be subtracted only after confirming eligibility and payment conditions.
Step 2 Calculate Annual Peak Demand Charge Savings
Many commercial and industrial electricity tariffs include demand charges based on the highest measured power demand during a billing period. Battery peak shaving reduces the site's grid import during high-demand intervals, potentially lowering the billed demand.
Assume the facility has:
· A demand charge of $18 per kW per month
· A baseline monthly billing peak of 800 kW
· A modeled billing peak of 600 kW after battery dispatch
· A demand reduction of 200 kW in each of 12 billing months
Annual Demand Charge Savings = Demand Reduction (kW) × Demand Charge ($/kW/month) × 12
Annual Demand Charge Savings = 200 × $18 × 12
Annual Demand Charge Savings = $43,200
This result assumes the battery can reduce every monthly billing peak by 200 kW. In practice, this requires an interval-by-interval simulation because one missed peak can materially reduce the savings for that month. If the utility applies ratchet charges, time-dependent demand charges, or additional capacity fees, those provisions must also be modeled.
Step 3 Calculate Time of Use Electricity Arbitrage Savings
Electricity price arbitrage involves charging the battery when electricity prices are lower and discharging when electricity prices are higher. The calculation must account for round-trip efficiency, because the electricity purchased to charge the battery exceeds the amount eventually delivered.
Annual Arbitrage Savings = (Discharged Energy × Peak Electricity Price − Charging Energy × Off-Peak Electricity Price) × Operating Days
Where:
Charging Energy = Discharged Energy / Round-Trip Efficiency
Assume the following operating conditions for the facility:
· Net AC energy discharged for arbitrage: 300 kWh per operating day
· Peak electricity price: $0.20/kWh
· Off-peak charging price: $0.09/kWh
· Assumed AC-to-AC round-trip efficiency: 90%
· Operating days: 250 per year
Daily Discharge Value = 300 × $0.20 = $60
Daily Charging Energy = 300 / 0.90 = 333.33 kWh
Daily Charging Cost = 333.33 × $0.09 = $30
Daily Arbitrage Savings = $60 − $30 = $30
Annual Arbitrage Savings = $30 × 250 = $7,500
For this illustrative joint dispatch, the battery delivers the same 300 kWh at 200 kW over a 1.5-hour peak-price period on 250 operating days. That discharge both avoids peak-price electricity purchases and reduces billed demand. The example assumes all monthly billing peaks can be controlled in those windows and off-peak recharging creates no new peak. With an illustrative 90% usable battery window and 95% discharge efficiency, 500 kWh nominal energy provides 427.5 kWh of usable AC energy at beginning of life, enough for the 300 kWh event. A real model must verify the load shape, charging opportunity and future degraded capacity.
If a battery charges at $0.15/kWh and discharges at $0.20/kWh with the same 90% efficiency, its net value per discharged kWh would be only about $0.0333 before additional operating costs. This illustrates why the electricity price difference alone is not enough to establish profitability.
6
0
0
Comments
All Comments (0)